Branding ROI in Kerala: How to Measure Real Returns
The rebrand is complete. The logo looks sharper, the website feels more credible and the social media pages finally appear consistent.
Everyone likes the result.
Then someone asks: What did the business gain?
That question is at the heart of branding ROI Kerala businesses need to measure.
Branding should not be judged only by visual quality, likes, impressions or stakeholder approval. These can show that the work was noticed, but they do not prove that it created a commercial return.
A useful branding ROI review asks whether the brand helped the business attract better enquiries, convert more customers, protect its pricing or retain buyers for longer.
For a Kochi training institute, that may mean more serious applicants. For a clinic, it may mean more appointment bookings. For a jewellery showroom, it may appear as stronger walk-ins, better conversion and repeat purchases.
Branding becomes commercially valuable when it changes how customers notice, trust, choose and return to a business.
What Branding ROI Really Means
Branding ROI is the financial return created by an investment in brand strategy, positioning, identity, communication, customer experience and promotion.
The formula is:
Branding ROI =
(Incremental contribution profit − total brand investment) ÷ total brand investment × 100
The formula is simple. The numbers behind it require care.
Total brand investment includes more than the design fee. It may cover research, strategy, website changes, photography, signage, packaging, staff training, sales materials, campaign production and media spending.
A textile business with several outlets, for example, may spend more implementing the new identity across signboards, shopping bags and store materials than it spent creating the identity itself.
Incremental revenue is the additional revenue earned above what the business would probably have generated without the branding activity.
If sales rise after a rebrand, branding may have contributed. But seasonality, discounts, referrals, advertising or changes in the sales team may also have influenced the result.
Contribution profit is the money remaining after the variable costs of serving those additional customers are deducted.
Suppose a training institute earns ₹40,000 from an extra enrolment. Trainer costs, learning materials, certification fees and commissions total ₹16,000. The revenue is ₹40,000, but the contribution profit is ₹24,000.
That ₹24,000 is the more useful figure for calculating return because it shows how much value remains to recover the branding investment.
A Better-Looking Brand Is Not Automatically a Better-Performing Brand
Good design matters. Customers often judge a company through its website, showroom, packaging, signboard or sales presentation before speaking to anyone.
A stronger identity may improve recognition and credibility. But those improvements are only the beginning.
Imagine a clinic that launches a new identity and website. The commercial result is not the fact that the new colours look professional. It is whether the clinic receives more relevant enquiries, converts more of them into appointments and retains more patients.
A resort may invest in stronger photography and a better booking experience. The branding creates value when more guests enquire directly, conversion improves or the business becomes less dependent on high-commission booking platforms.
This is why likes and impressions are weak final measures. They show attention, not business value.
A brand can look excellent and still fail commercially if it reaches the wrong audience, communicates an unclear promise or attracts people who never buy.
The better question is not, “Do people like the new brand?”
It is, “Did the new brand improve the customer journey or the economics of the business?”
How Kerala Businesses Can Measure Branding ROI
Most Kerala small and medium-sized businesses do not need complex research systems. They need a clear baseline and consistent tracking.
Start by recording normal business performance before the branding activity begins. The comparison period should reflect the way the company sells.
A resort should compare similar travel seasons. A jewellery business should account for wedding and festival demand. A training institute should compare one admissions cycle with another.
The baseline should focus on the measures closest to revenue: enquiries, qualified leads, appointments, site visits, sales conversion, average sale value, repeat purchases or sales-cycle length.
Next, connect the main enquiry sources to actual sales outcomes. Track customer contact across WhatsApp, phone calls, Google Business Profile, website forms and physical visits. The aim is not to create a large dashboard. It is to see which enquiries were suitable and what happened after they arrived.
This distinction matters because more leads do not always mean better branding.
An architecture firm may receive fewer enquiries after clarifying its premium positioning. However, those enquiries may involve stronger budgets, clearer requirements and less resistance to professional fees. That can be a better business result than a large increase in low-quality messages.
Customer feedback adds context. Ask how buyers first discovered the company, what made them enquire and what gave them confidence to choose it.
A customer may notice a roadside sign, follow the company on Instagram and finally contact it through Google. The final channel receives the credit, but earlier brand exposure may have created the recognition and trust.
Businesses with several branches can strengthen the analysis by comparing locations. A retailer might introduce new communication in selected outlets before expanding it across Kerala. Differences in walk-ins, conversion and average bill value can provide more useful evidence than a statewide before-and-after comparison.
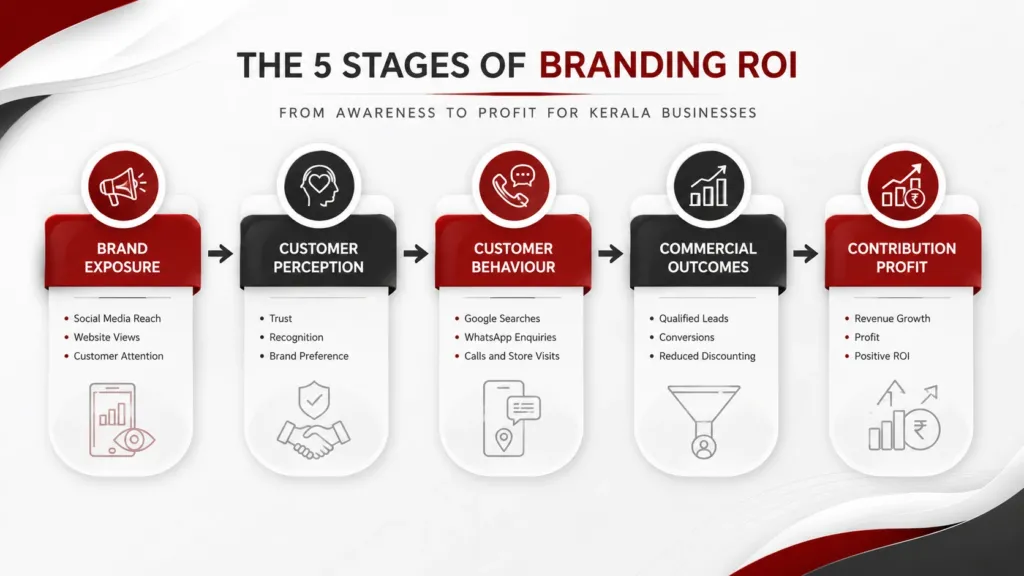
Branding ROI Kerala: The Five-Layer Model
Branding usually creates value through a chain of effects.
Layer | What it measures | Useful indicators | Example |
Brand exposure | Whether the intended audience noticed the business | Relevant reach, profile views, website visits | A retailer measures whether more nearby customers discover its store |
Customer perception | Whether trust, awareness or preference changed | Recall, consideration, perceived expertise | A clinic checks whether patients associate it with a priority service |
Customer behaviour | Whether people acted on that perception | Branded searches, calls, enquiries, visits | A jewellery showroom tracks searches and appointment requests |
Commercial outcomes | Whether customer action improved business performance | Qualified leads, conversion, average discount | A real estate firm measures site visits and bookings |
Incremental contribution profit | Whether the additional profit exceeded the investment | Additional sales, margin and ROI | A training institute calculates contribution from extra enrolments |
The first two layers show whether the brand reached the right people and changed what they thought. The next two reveal whether that change influenced behaviour and commercial performance.
The final layer answers the financial question.
This model also helps identify where the branding is failing.
High exposure with no change in perception may indicate a weak message. Better perception without action may suggest an unclear offer. More enquiries without stronger contribution may point to poor lead quality, heavy discounting or weak sales conversion.
For eligible larger campaigns, Google Brand Lift can measure changes such as awareness and consideration. Smaller businesses can use the same principle through short customer surveys and consistent sales tracking.
Which Metrics Matter Most?
A useful branding scorecard should contain a small number of connected measures.
Branding metric | What it may indicate | Business outcome to verify |
Branded-search growth | More people remember and seek the company | Qualified enquiries and conversion |
Direct website traffic | More visitors arrive without a campaign click | Enquiry quality |
Google Business Profile actions | Local interest is increasing | Appointments, visits or sales |
Qualified enquiry rate | Positioning attracts better-fit prospects | Proposal value and conversion |
Sales conversion | Trust or communication has improved | Completed sales and contribution |
Average discount | Pricing confidence has changed | Contribution margin |
Repeat purchases | Customers continue to prefer the business | Retention and customer value |
Sales-cycle length | Prospects require less persuasion | Sales efficiency |
These measures should be read together.
A rise in branded searches is useful only when the resulting visitors include suitable customers. More Google Business Profile actions matter when they lead to real appointments, showroom visits or purchases.
The goal is not to collect every possible metric. It is to select the few that explain how the brand influences the customer journey.
Branding Often Helps Other Channels Get Better Results
Branding does not always receive direct credit for the value it creates.
A customer may first notice an outdoor campaign, later watch a video on Instagram and finally search for the company on Google. The analytics report may credit Google Search with the enquiry, even though earlier brand exposure created recognition and preference.
The same effect can improve Meta Ads, Google Ads and SEO. A familiar company name and a clear message can make an advertisement or search result more persuasive. A credible website can then improve the chance that the visitor makes contact.
Sales teams benefit as well. Clear positioning helps them explain the offer. Better presentations and customer proof can reduce uncertainty and shorten the sales process.
For an architecture firm, the effect may appear as fewer introductory meetings before a proposal. For an automobile dealership, it may appear as more showroom visitors arriving with a clear preference.
Branding should not receive full credit for every sale. But the final channel should not automatically receive all the credit either.
How to Separate Branding Impact from Normal Business Growth
The hardest question is not what happened after the campaign.
It is what would have happened anyway.
A before-and-after comparison is useful, but timing alone does not prove causation. Sales may rise because of seasonal demand, a price reduction, increased advertising or a competitor problem.
A stronger assessment combines several practical methods:
- Compare equivalent periods rather than unrelated months.
- Use the same definition of a qualified lead before and after the campaign.
- Record changes in pricing, promotions, media spending and sales capacity.
- Compare branches or districts where practical.
- Use customer feedback to understand why buyers acted.
Larger advertisers may also use controlled experiments. Google Conversion Lift, where available, compares exposed and control groups to estimate additional conversions.
Marketing mix modelling is another advanced option. It uses historical data to estimate how different channels and outside factors influenced performance. Google Meridian is one framework for this type of analysis.
Most Kerala small businesses do not need marketing mix modelling. A reliable baseline, consistent lead tracking, customer surveys and location-wise comparisons will usually provide more immediate value.
The right measurement method is not the most technical one. It is the simplest method that gives management enough confidence to make a decision.
Illustrative Example: A Kochi Training Institute
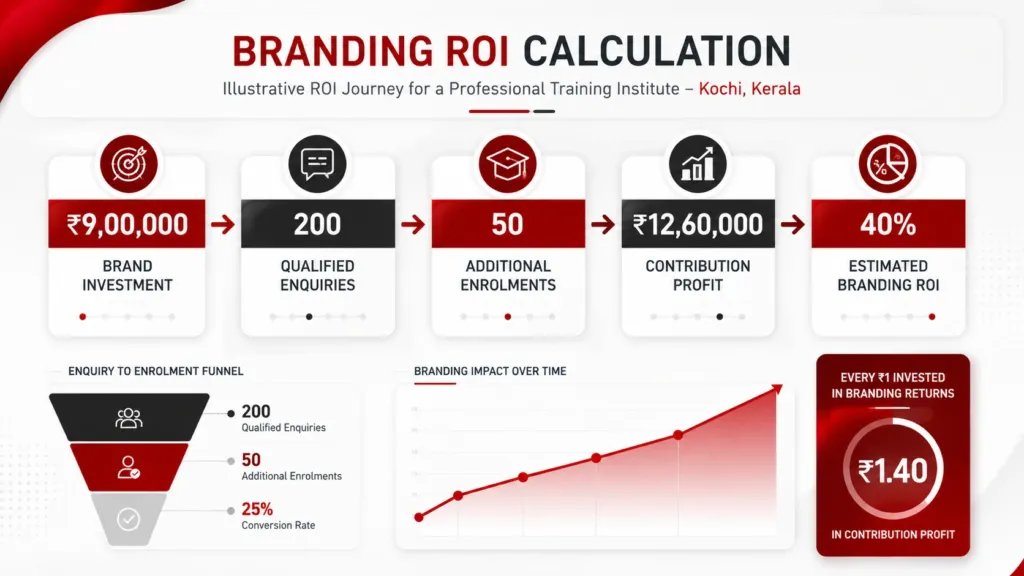
This is an illustrative example, not a real client result or industry benchmark.
A professional training institute in Kochi receives many enquiries, but too few come from serious students. Prospects compare courses mainly on price, and counsellors spend too much time explaining why the programmes cost more than cheaper alternatives.
The institute invests in clearer positioning, a new identity, improved course pages, testimonial videos, branch signage, sales materials and a six-month campaign.
Investment item | Cost |
Research, strategy and identity | ₹2,50,000 |
Website and content updates | ₹1,50,000 |
Photography and video | ₹1,00,000 |
Signage and printed materials | ₹75,000 |
Staff and counsellor training | ₹25,000 |
Campaign production and media | ₹3,00,000 |
Total brand investment | ₹9,00,000 |
After comparing the campaign with a similar admissions cycle and adjusting for changes in media spending, management estimates that the programme produced 200 incremental qualified enquiries.
At a 25% enrolment rate, those enquiries create 50 additional enrolments. Average revenue per enrolment is ₹42,000, and the contribution margin is 60%.
Incremental revenue
50 × ₹42,000 = ₹21,00,000
Incremental contribution profit
₹21,00,000 × 60% = ₹12,60,000
Expected branding ROI
(₹12,60,000 − ₹9,00,000) ÷ ₹9,00,000 × 100 = 40%
The ₹21,00,000 figure is additional revenue. After variable delivery costs, ₹12,60,000 remains as contribution profit.
Because the calculation depends on assumptions, management should review more than one scenario.
Scenario | Incremental contribution | Estimated ROI |
Conservative | ₹9,90,000 | 10% |
Expected | ₹12,60,000 | 40% |
Higher | ₹14,40,000 | 60% |
The range is more useful than a single optimistic figure. It shows how the decision changes when the assumptions change.
Seven Mistakes That Make Branding ROI Less Credible
Treating impressions as ROI. Impressions show that content may have appeared. They do not prove that customers remembered, trusted or chose the business.
Reporting pipeline as revenue. A ₹1 crore opportunity pipeline is not ₹1 crore in completed sales. Some opportunities will be lost or reduced in value.
Using revenue instead of contribution profit. Revenue ignores the variable cost of serving additional customers and can overstate the return.
Ignoring implementation costs. Website work, signage, photography, packaging, training and media should be included alongside strategy and design fees.
Double counting results. One sale should not be fully credited to branding, paid advertising, SEO and the sales team.
Assuming timing proves causation. An increase after a rebrand may also reflect seasonality, promotions, competitor activity or operational changes.
Presenting estimates as facts. Branding measurement often depends on assumptions. Results should be labelled as observed, estimated, modelled or illustrative.
A Practical Measurement Checklist
- Define the commercial outcome the branding should improve.
- Establish a baseline using a relevant comparison period.
- Agree on the meaning of a qualified lead and contribution profit.
- Connect enquiry sources with conversion and sales data.
- Record seasonal, pricing, media and operational changes.
- Compare perception, behaviour and commercial outcomes.
- Calculate conservative, expected and higher scenarios.
- Decide whether to continue, adjust, expand or stop the activity.
Frequently Asked Questions
There is no universal target. A suitable return depends on the contribution margin, buying cycle, investment size, risk and expected duration of the brand effect. The result should be compared with the original business objective and other realistic uses of the same budget.
Early signals such as direct traffic, branded searches and relevant enquiries may appear within weeks. Sales, retention and repeat purchases often require several months or full buying cycles. Short-term behaviour and longer-term commercial outcomes should be reviewed separately.
Yes. A spreadsheet or simple CRM can be enough when the business has clear lead definitions, consistent source tracking and a reliable baseline. Customer surveys and branch comparisons can improve the analysis without requiring expensive software.
Likes may show that content attracted attention, but they do not prove a financial return. They become more useful when connected with relevant visits, enquiries, appointments or sales.
It may improve campaign performance by increasing recognition, clarity and trust. The business should check qualified-lead cost, conversion and contribution per acquired customer rather than relying only on cost per click.
Repeat purchases and retention may be included when they are measured against a reasonable baseline. Only the additional contribution plausibly connected to the branding activity should be counted.
Specialist help is useful when the investment is large, the company operates across several locations or multiple channels claim the same sales. It may also be needed for controlled experiments, statistical analysis or board-level reporting.
Measuring branding ROI in Kerala is not about forcing every design decision into a financial calculation.
It is about finding out whether better recognition, clearer positioning and stronger trust changed the way the business attracts, converts and retains customers.
A credible assessment starts with a baseline, follows suitable prospects through the sales process and uses contribution profit rather than total revenue. It also acknowledges uncertainty instead of presenting estimates as proven facts.
Branding earns commercial value when it makes the business easier to notice, easier to trust and easier to choose—and when those changes create enough additional contribution to justify the investment.
Know What Your Branding Is Returning
Connect brand visibility with better leads, conversions and contribution profit.
Book a Branding ROI Review →